
Wages in Sweden 2025 — and How They Compare Across the EU
Wage statistics, EU comparisons, and the cost of living
When I guide tourists and visitors around Stockholm, I’m often asked the same question: what do people actually earn in Sweden? The question comes up in almost every group, and it’s what prompted this article.
I’ve received pay slips in several countries myself — Sweden, where I’ve lived the longest, Switzerland, where I earned the most, and the Netherlands, where I lived for just under a year. Wage levels differ sharply even within the EU, despite a shared market and free movement of labor.
Which figure are we actually talking about?
Wages can be described in at least three ways, and the three answers differ by thousands of kronor.
The median wage is the one right in the middle of the distribution — half of earners make more, half make less. It’s the figure economists tend to point to, since it isn’t skewed by a small number of very high earners.
The mean wage (or “average”) is the sum of all wages divided by the number of earners. It gets pulled upward by those who earn a great deal, even if they are few.
The mode is the wage level that the largest number of people actually have — the peak of the distribution curve. It’s rarely published as a single exact figure, more often as a range read from the wage-distribution histogram.
When the mean sits clearly above the median, as it does in Sweden, that means the distribution is skewed: more people earn far above the typical level than far below it.
Sweden’s wage ladder for 2025, figure by figure
According to SCB (Statistics Sweden) and the Swedish National Mediation Office’s wage structure statistics for 2025 (the latest data, published in 2026):
- Median wage: SEK 38,300 per month
- Mean wage: SEK 42,900 per month — up SEK 1,300 from 2024
- Mode: roughly SEK 33,000–35,000, based on the wage-distribution histogram
- 75th percentile: roughly SEK 48,000
- 90th percentile: roughly SEK 61,700
- 99th percentile: roughly SEK 108,500
- Earning SEK 100,000+ per month: 1.6 percent of all wage earners
There is also a clear gender gap: women’s mean wage was SEK 40,600, men’s SEK 45,100 — a difference of just over 11 percent.
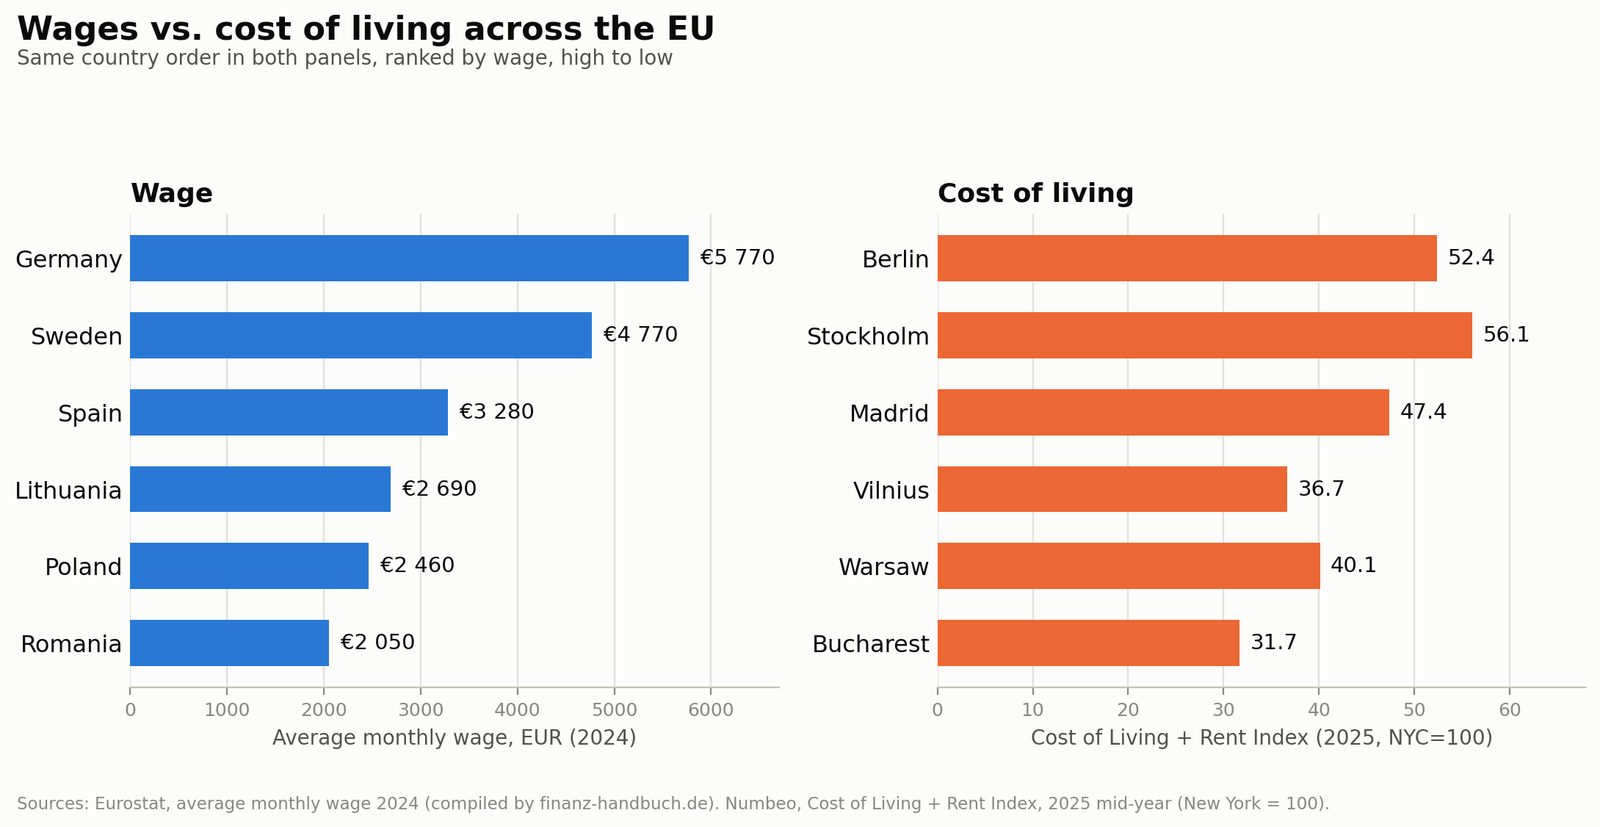
Average monthly wages across six EU countries (Eurostat, 2024) set beside Numbeo’s cost-of-living-plus-rent index for their capital or major city (2025), showing that a lower nominal wage often comes with a lower cost of living. Chart created by Zayera Khan from Eurostat and Numbeo data.
Where does the gap to the top begin?
The gap between the median wage and the highest percentiles is wide. From the median (SEK 38,300) to the 99th percentile (SEK 108,500) is nearly a threefold difference.
At the same time, only 1.6 percent of wage earners reach SEK 100,000 a month. That figure, often used to represent “the top” in social media posts, applies to a small minority — not a realistic benchmark for most people.
Zooming out to the EU: same profession, different reality
According to Eurostat’s wage statistics for 2024 (the latest complete comparison available, converted to average monthly wage in euros):
- Germany: approximately €5,770 per month
- Sweden: approximately €4,770 per month
- Lithuania: approximately €2,690 per month
- Spain: approximately €3,280 per month
- Poland: approximately €2,460 per month
- Romania: approximately €2,050 per month
The gap between Germany and Romania is nearly threefold. Sweden sits close to the middle of this range in euro terms, despite being widely regarded as one of the EU’s wealthier member states.
An earlier Eurostat comparison (2022) shows that Swedish and German hourly wages were almost identical — €19.3 and €19.4 respectively. The gap in monthly wages, then, doesn’t come primarily from a difference in hourly pay, but from working-hour patterns, bonus structures, and how each economy is composed.
What the money is worth: wages in relation to the cost of living
The nominal gap in euros is only part of the picture. According to Eurostat’s price level index for household consumption in 2024 (EU average set at 100), Poland’s price level stands at 72 and Romania’s at 64 — among the lowest in the entire union.
Numbeo’s Cost of Living Plus Rent Index (2025, mid-year, New York = 100) points to a similar pattern at the city level:
- Stockholm: 56.1
- Berlin: 52.4
- Madrid: 47.4
- Warsaw: 40.1
- Vilnius: 36.7
- Bucharest: 31.7
Sweden’s wage distribution for 2025, from the most common wage level to the top one percent. Source: SCB and Medlingsinstitutet wage structure statistics, 2025 data, published 2026. Chart created by Zayera Khan from official SCB/Medlingsinstitutet data.
Both measures point in the same direction: a wage of €2,050 in Romania or €2,460 in Poland goes relatively further locally — for housing, food, and other everyday costs — than the same amount would in Sweden or Germany. The real purchasing-power gap between countries is therefore less dramatic than the nominal euro figures suggest, even if a gap remains.
A comparison of gross wages between EU countries needs to be paired with local price levels to give a fair picture of actual living standards.
Sources: SCB, Wage Structure Statistics and Average/Median Wages in Sweden (2025 data, published 2026). Swedish National Mediation Office (Medlingsinstitutet), “Sweden’s average monthly wage was SEK 42,900” (2026) and “This is how the wage distribution looks” (2025). Percentile figures (75th/90th/99th, mode) via RikaTillsammans’ wage comparison tool, based on the same SCB/Medlingsinstitutet data. Eurostat, wage comparison and price level index for household consumption 2024 (compiled by finanz-handbuch.de). Numbeo, Cost of Living Plus Rent Index, 2025 mid-year.